Overview
The Profitability Analysis report compares billed revenue with recorded cost across a selected date range.
Use it to answer questions such as:
Where are we making money, where are we losing money, and what might need investigation?
The report provides profitability views by billing period, Product Master, customer, and salesperson, with supporting billing-line data for deeper investigation.
For instructions on generating and downloading reports, see Generating Reports.
Before You Analyze Profitability
Profitability results are only as reliable as the cost recorded against the billing data.
The report calculates profit as:
Profit = Billed revenue − Recorded cost
Where applicable, the report also expresses profit as a percentage of billed revenue.
Warning: If no cost is recorded for a billed item, a zero cost may cause profitability to appear higher than it actually is. Confirm that the required cost data is present before relying on the result.
Warning: Cost is captured when billing is produced. Adding or changing cost afterwards does not retrospectively update profitability for billing that has already been produced. Historical profitability continues to reflect the cost recorded at the time of billing production.
Depending on your billing setup, cost may come from Varibill pricing or from rated source data. For example, some rated Source Collectors can provide vendor cost alongside the amount charged.
Note: The Profit Margin % shown in this report is based on the billed revenue and recorded cost available to Varibill. It should be used as an analytical view rather than as a complete measure of your overall business margin.
What to Look at First
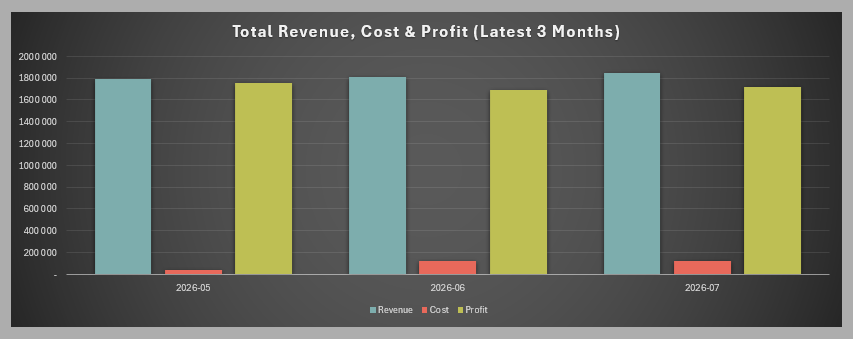
Start with the Total Profit Graph for a high-level view of profitability.
The revenue, cost, and profit chart displays only the latest three billing periods included in the report, regardless of the date range selected. If the selected range contains more than three billing periods, the earlier periods remain available in the detailed report views but are not shown in this graph.
Look for:
- periods where profit changes significantly;
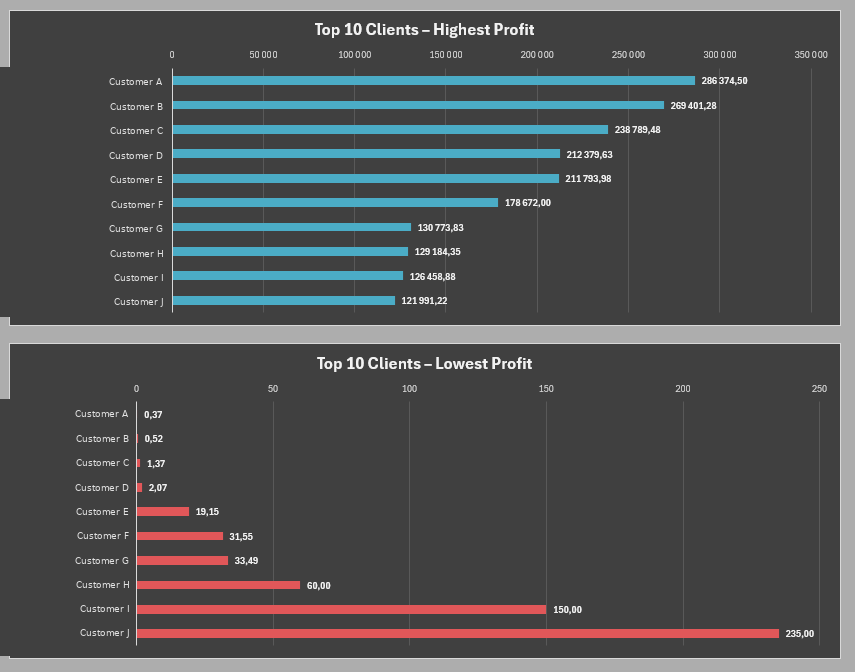
- customers with the lowest profit, particularly where profit is zero or negative;
- customers contributing strongly to positive profit;
- Product Masters with low or negative profitability; and
- unexpected differences between billed revenue and recorded cost.
A positive overall result can still contain individual products, customers, or billing lines that are being billed at cost or at a loss. Drill into unusual results rather than relying only on the overall total.
Understand the Results
Positive Profit
When billed revenue is greater than recorded cost, the report shows positive profit.
This indicates that the billed amount exceeds the cost recorded against that billing data.
The size of the reported profit should still be interpreted in the context of the cost information available to Varibill.
Billed at Cost
When:
Revenue = Cost
the billed amount exactly covers the recorded cost and the report shows zero profit for that item.
This may be intentional, but it can also indicate pricing that has not been updated when underlying costs changed.
The Total Profit Graph identifies customers invoiced at zero profit. Use this view as a starting point, then investigate the supporting analysis to determine whether the result is expected.
Investigate billed-at-cost items where you would normally expect a markup.
Billed Below Cost
When:
Revenue < Cost
the report shows negative profit.
This means the recorded cost exceeds the amount billed for that item.
A negative result is not automatically an error. For example, some pricing may intentionally operate as a loss leader. Investigate whether the result matches the intended pricing strategy.
Cost with No Billed Revenue
When:
Revenue = 0 and Cost > 0
a cost has been recorded but no revenue was billed against the item.
This result can help identify items that may require further investigation.
Check whether:
- the absence of billed revenue is expected;
- the applicable pricing or rate configuration is correct; and
- the recorded cost is valid for the item.
Investigate a Profitability Issue
When a summary result requires investigation, work from the high-level view into the supporting detail.
Product Master
Use Product Master Profit Analysis to identify the Product Masters and products contributing to the result.
This helps isolate pricing or cost issues that may affect a particular product area.
Customer
Use Client Profit Analysis to investigate profitability for a specific customer and the products billed to them.
This is useful when overall customer revenue appears healthy but individual products or services are producing low or negative profit.
Salesperson
Use Sales Person Profit Analysis to review profitability associated with each salesperson and their customers.
Warning: Billing without a salesperson assigned at contract level appears as Unassigned. Assigning a salesperson later does not rewrite previously billed data.
What to Do When You Find a Problem
First determine whether the result is expected.
If the pricing or cost is correct and the result reflects an intentional commercial decision, no correction may be required.
If the result is unexpected:
- Identify the affected customer, product, or billing line.
- Confirm the selling value and recorded cost.
- Check the applicable pricing, cost, or upstream source configuration.
- Correct the configuration where required.
- Confirm that subsequent billing reflects the correction.
Warning: Changes made after billing do not recalculate previously billed data. Historical report results continue to reflect the values that applied when that billing was produced.
Where a rated Source Collector supplies the cost, follow the applicable Source Collector process if the underlying source data requires correction or recollection.
Validate Recorded Cost
Where cost originates from a supplier or vendor system, the supplier invoice can provide an additional validation point.
For the same billing period, compare the total recorded cost used in your analysis with the relevant supplier invoice where practical.
A difference may indicate that the cost data or the scope being compared requires further investigation.
Note: Profitability Analysis does not automatically reconcile supplier invoices. This is an external validation step using the available report data and the corresponding supplier information.
Report Views
Total Profit Graph
Start here for the report’s summary profitability views.
The dashboard includes:
- revenue, cost, and profit across the latest three billing periods;
- the top 10 customers with the highest profit; and
- the top 10 customers with the lowest profit.
Product Master Profit Graph
Use this view to understand profitability across Product Masters.
It includes:
- revenue, cost, and profit by Product Master;
- revenue share by Product Master;
- profit margin percentage by Product Master; and
- profit by Product Master across the latest three billing periods.
Detailed Profitability Views
The workbook provides supporting analysis through:
- Total Revenue Profit Analysis: period-level revenue, cost, and profit.
- Product Master Profit Analysis: profitability by Product Master, product, and customer.
- Client Profit Analysis: profitability by customer and related products.
- Sales Person Profit Analysis: profitability by salesperson and customer.
Use these views to investigate something identified in the summary graphs in more detail.
Use the Underlying Billing Data
The VB#BHLI sheet contains the billing line-item data used to produce the profitability analysis.
Use it when you need to:
- trace a summarized result back to individual billing lines;
- compare billed revenue with recorded cost;
- investigate items billed at cost or below cost;
- reconcile report totals; or
- perform your own analysis in Excel.
The prepared report views provide common profitability analyses, while the underlying billing data can be filtered, grouped, or used in your own PivotTables when a different view is required.
Important Considerations
- The selected date range determines the billing data included in the report.
- Profitability depends on the cost recorded against that billing data.
- Missing cost can overstate profitability.
- Positive overall profitability can hide individual loss-making billing lines.
- Negative profit does not automatically indicate an error; confirm whether the pricing is intentional.
- Reported Profit Margin % reflects billed revenue and recorded cost available to Varibill and should not be treated as a complete measure of overall business margin.
Was this article helpful?
That’s Great!
Thank you for your feedback
Sorry! We couldn't be helpful
Thank you for your feedback
Feedback sent
We appreciate your effort and will try to fix the article