Overview
The Billing Comparison report compares billed revenue across a selected date range.
Use it to answer questions such as:
How has billed revenue differed across these billing periods, and which products, customers, or salespeople contributed to the result?
The report provides summary graphs, comparative revenue views, and supporting billing-line data for deeper investigation.
For instructions on generating and downloading reports, see Generating Reports.
What to Look at First
Start with the summary graphs to understand revenue across the selected billing periods.
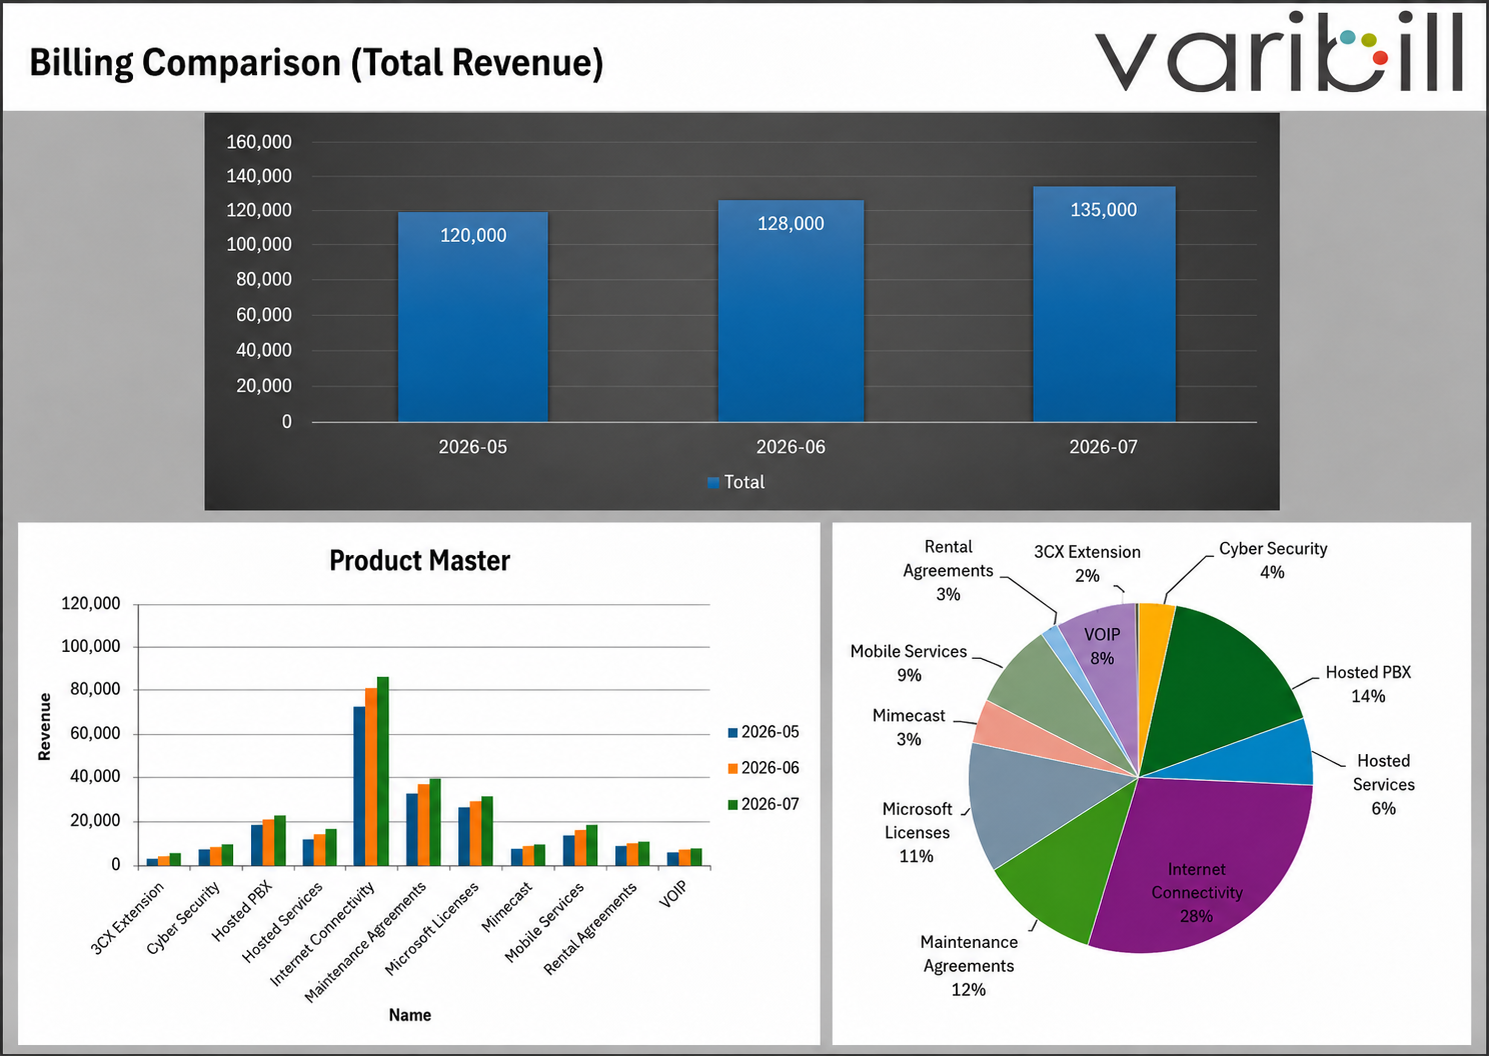
Look for:
- periods with noticeably higher or lower billed revenue;
- Product Masters contributing significantly to total revenue;
- customers with unexpected differences between billing periods;
- changes in revenue attributed to salespeople; and
- the Grand Total across the selected billing periods.
A difference between billing periods does not automatically indicate a billing problem. Use the supporting comparison views to determine where the difference originates.
Understand the Comparison
The report groups billed revenue by billing period within the selected date range.
The comparison views also include a Grand Total, showing the combined revenue across the selected periods.
Use the period values to compare individual billing periods and the Grand Total to understand the overall value represented by the report.
Investigate a Difference
When a revenue difference requires further investigation, work from the summary view into the relevant comparison.
Product Master
Use Product Master Comparison to compare billed revenue by Product Master and identify the products contributing to the result.
Customer
Use Client Comparison to compare billed revenue by customer and investigate customers with unexpected differences between periods.
Salesperson
Use Sales Person Comparison to compare the revenue attributed to each salesperson.
Warning: Billing without a salesperson assigned at contract level appears as Unassigned. Assigning a salesperson later does not rewrite previously billed data.
Report Views
Total Revenue Graph
Use this view for a visual comparison of billed revenue across the selected billing periods and to identify periods that warrant further investigation.
Product Master Graph
Use this view to compare revenue across Product Masters and identify the areas contributing most to billed revenue.
Detailed Comparison Views
The workbook provides supporting analysis through:
- Total Revenue: revenue by billing period and the total across the selected range.
- Product Master Comparison: revenue comparison by Product Master.
- Client Comparison: revenue comparison by customer.
- Sales Person Comparison: revenue comparison by salesperson.
Use these views to investigate differences identified in the summary graphs.
Use the Underlying Billing Data
The VB#BHLI sheet contains the billing line-item data used to produce the report.
Use it when you need to:
- trace a summarized revenue value back to individual billing lines;
- reconcile report totals;
- investigate differences between billing periods; or
- perform your own analysis in Excel.
The prepared comparison views provide common revenue analyses, while the underlying billing data can be filtered, grouped, or used in your own PivotTables when a different view is required.
Important Considerations
- The selected date range determines the billing periods included in the report.
- Revenue values are based on billed data for those periods.
- The Grand Total represents the combined revenue across the selected billing periods.
- Missing salesperson or product-group configuration can affect how report results are grouped.
- Changes made after billing do not rewrite historical billing results.
Was this article helpful?
That’s Great!
Thank you for your feedback
Sorry! We couldn't be helpful
Thank you for your feedback
Feedback sent
We appreciate your effort and will try to fix the article