Overview
Varibill Reports helps you turn billing data into useful business views. From comparing revenue between billing periods to reviewing profitability and checking pricing.
Navigate to Reports from the navigation dropdown menu.
The Reports screen contains two tabs:
- Available Reports: generate a new report.
- Processed Reports: download or remove reports that have already been generated.
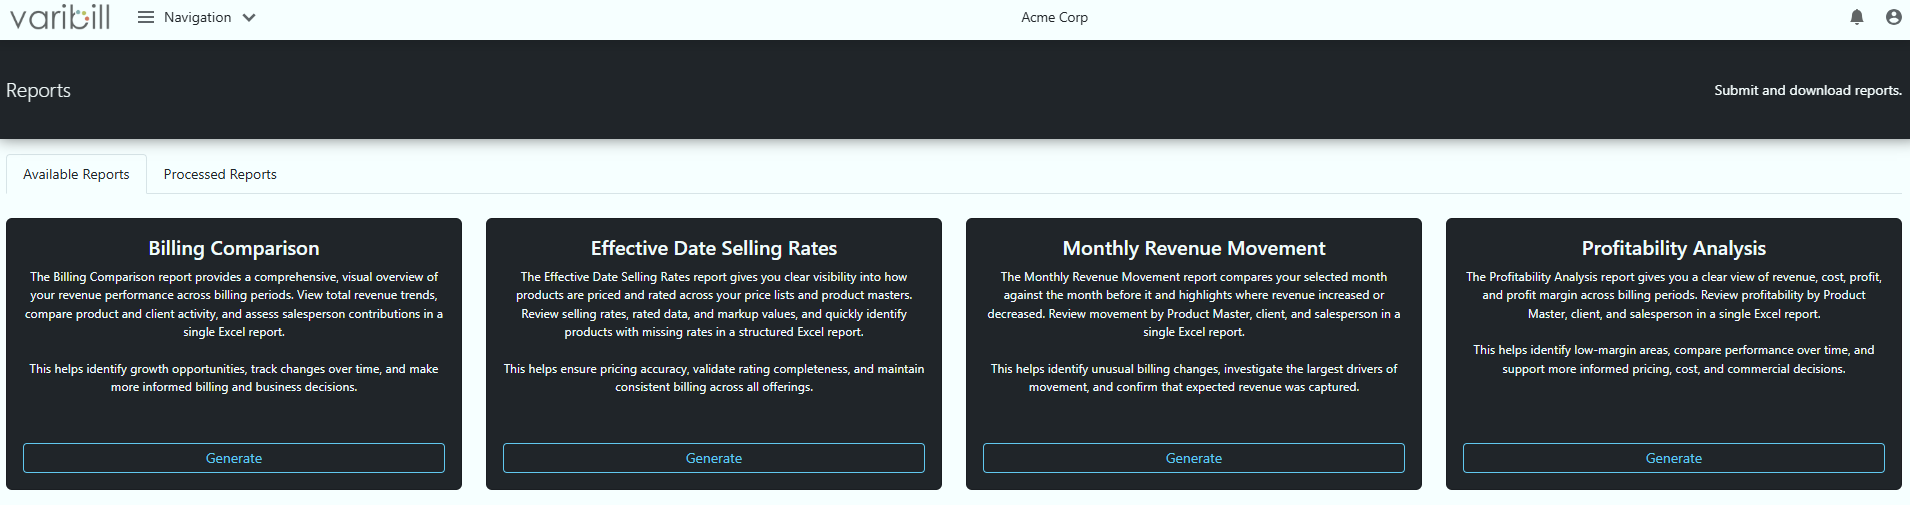
For step-by-step instructions, see Generating Reports.
Choose a Report
Billing Comparison
Use Billing Comparison when you want to compare billed revenue across a selected date range.
It helps you review revenue by Product Master, customer, and salesperson and investigate differences across billing periods.
Learn more about the Billing Comparison Report
Monthly Revenue Movement
Use Monthly Revenue Movement when you want to know what changed from one billing period to the next.
It highlights revenue increases and decreases and helps identify the customers, products, and salespeople behind those movements.
Learn more about the Monthly Revenue Movement Report
Profitability Analysis
Use Profitability Analysis when you want to compare billed revenue with recorded cost.
It helps identify profitable and loss-making areas and investigate products or customers where pricing and cost may need attention.
Note: Profitability Analysis uses the cost recorded against the billing data. It should be used as an analytical view rather than as a complete measure of your overall business margin.
Learn more about the Profitability Analysis Report
Effective Date Selling Rates
Use Effective Date Selling Rates when you need to review selling-rate and pricing configuration at a selected point in time.
It can help with pricing validation and investigation where selling-rate configuration may be affecting billing.
Learn more about the Effective Date Selling Rates Report
Go Further with Report Data
Varibill reports provide prepared summaries and visual analysis, while the supporting data sheets let you investigate the underlying records in more detail.
For example, billing-analysis reports include the VB#BHLI sheet containing the billing line-item data used to produce the report. This can be used for reconciliation, detailed investigation, or your own analysis in Excel.
Was this article helpful?
That’s Great!
Thank you for your feedback
Sorry! We couldn't be helpful
Thank you for your feedback
Feedback sent
We appreciate your effort and will try to fix the article