Overview
The Monthly Revenue Movement report compares billed revenue for a selected month with the month immediately before it.
Use it to answer a simple question:
What changed since last month, and where did the change come from?
The report highlights increases and decreases in revenue and helps trace those changes to Product Masters, customers, and salespeople.
For instructions on generating and downloading reports, see Generating Reports.
How to Read Revenue Movement
The report compares:
Selected-month revenue − Previous-month revenue
- A positive movement means revenue increased.
- A negative movement means revenue decreased.
- A zero movement means billed revenue remained the same between the two months.
For example, selecting August 2026 compares August revenue with July revenue.
What to Look at First
Start with the summary views to understand the overall movement between the two months.
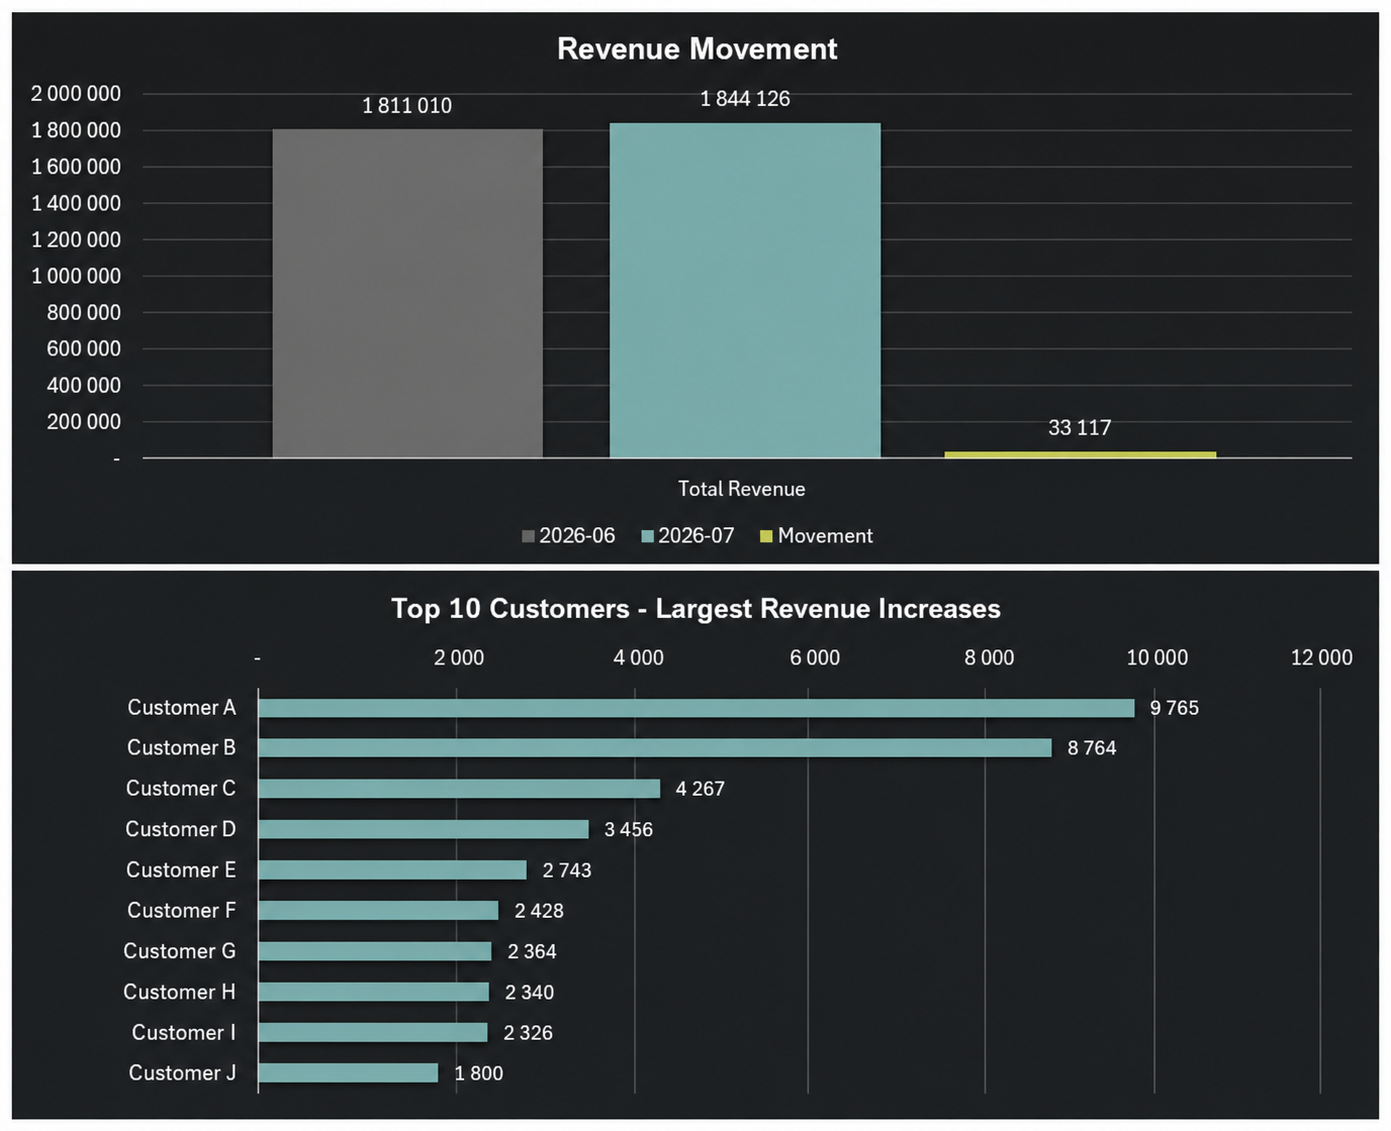
Look for:
- the difference between previous-month and selected-month revenue;
- the largest revenue increases;
- the largest revenue decreases;
- customers that were billed in the previous month but have no billed revenue in the selected month; and
- Product Masters or salespeople contributing significantly to the change.
A large movement does not automatically indicate a billing problem. It may reflect an expected change in billing activity and should be investigated in context.
Clients Zero Value
The report can highlight customers that had billed revenue in the previous month but no billed revenue in the selected month.
If a customer appears in Clients Zero Value, they had billing in the previous month but no billed revenue in the selected month.
The previous-period value shows the revenue billed in the earlier month, together with the related billing-line information. The selected month contains no billed revenue for that customer.
Note: A zero-value result does not automatically mean billing failed. It identifies a change between the two periods that may require investigation.
Check whether the change is expected based on the customer’s billing activity and configuration for the two periods.
Investigate a Movement
When something in the summary requires further investigation, work from the high-level result into the supporting detail.
Product Master
Use the Product Master views to identify which product areas contributed to the movement and then drill down into the related products and customers.
Customer
Use the customer views to see which products contributed to the increase or decrease for a particular customer.
Salesperson
Use the salesperson views to understand changes in the revenue associated with each salesperson and their customers.
Warning: If a salesperson was not assigned at contract level when billing occurred, the report shows the revenue as Unassigned. Assigning a salesperson later does not rewrite previously billed data.
Report Views
The workbook provides summary graphs first, followed by detailed views that can be used to investigate the movement.
Revenue Movement Graph
Start here for an overall view of the change between the two months.
The dashboard highlights:
- total revenue movement;
- the top 10 customers with the largest revenue increases;
- the top 10 customers with the largest revenue decreases;
- the top 10 salespeople with the largest revenue increases; and
- the top 10 salespeople with the largest revenue decreases.
Use these views to identify the areas that contributed most to the overall movement.
Product Master Movement Graph
Use this view to understand how Product Masters contributed to the change.
It includes:
- the largest revenue increases and decreases;
- period-over-period percentage change by Product Master;
- revenue movement by Product Master; and
- current-period revenue share by Product Master.
Clients Zero Value
Use Clients Zero Value to identify customers that had billing in the previous month but no billed revenue in the selected month.
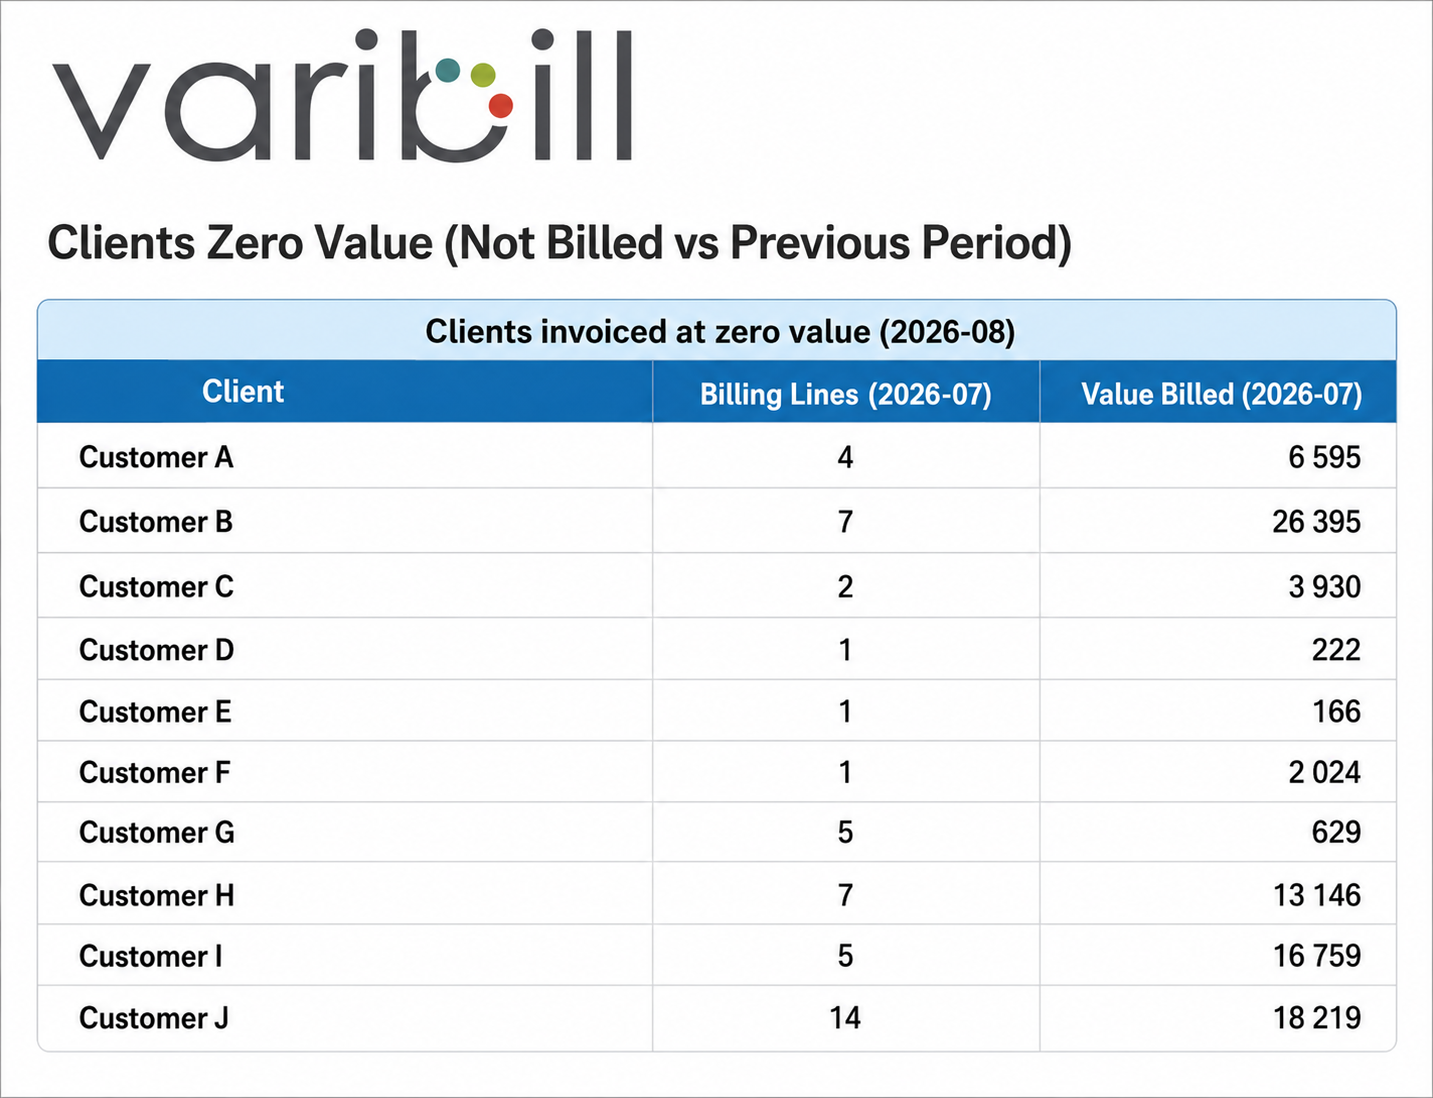
For help interpreting this view, see Clients Zero Value.
Detailed Movement Views
The following sheets provide supporting breakdowns:
- Total Revenue Movement: overall revenue movement between the two periods.
- Revenue Movement Product Master: revenue movement by Product Master.
- Revenue Movement Client: revenue movement by customer.
- Revenue Movement Sales Person: revenue movement by salesperson.
Use these views to investigate an item identified in the summary graphs in more detail.
Use the Underlying Billing Data
The VB#BHLI sheet contains the billing line-item data used to produce the report for both compared months.
Use this data when you need to:
- trace a summarized movement back to individual billing lines, invoices, or credit notes;
- reconcile report values;
- investigate unexpected revenue changes; or
- perform your own analysis in Excel.
The prepared report views show common ways to analyze revenue movement, but the underlying data can be filtered, grouped, or used in your own PivotTables when a different view is required.
Important Considerations
- The report compares the selected month with the month immediately before it.
- Revenue movement is based on billed revenue for those two periods.
- A decrease is not automatically an error; investigate whether the change is expected before treating it as a billing issue.
- Missing salesperson or Product Group configuration can affect how results are grouped in the report.
- Changes made after billing do not recalculate previously billed data.
Was this article helpful?
That’s Great!
Thank you for your feedback
Sorry! We couldn't be helpful
Thank you for your feedback
Feedback sent
We appreciate your effort and will try to fix the article